Alright! First of [likely] many project/blog posts! I'll go ahead and preface this as being a pretty surface level piece. Without full order book data, it's difficult to investigate liquidity.
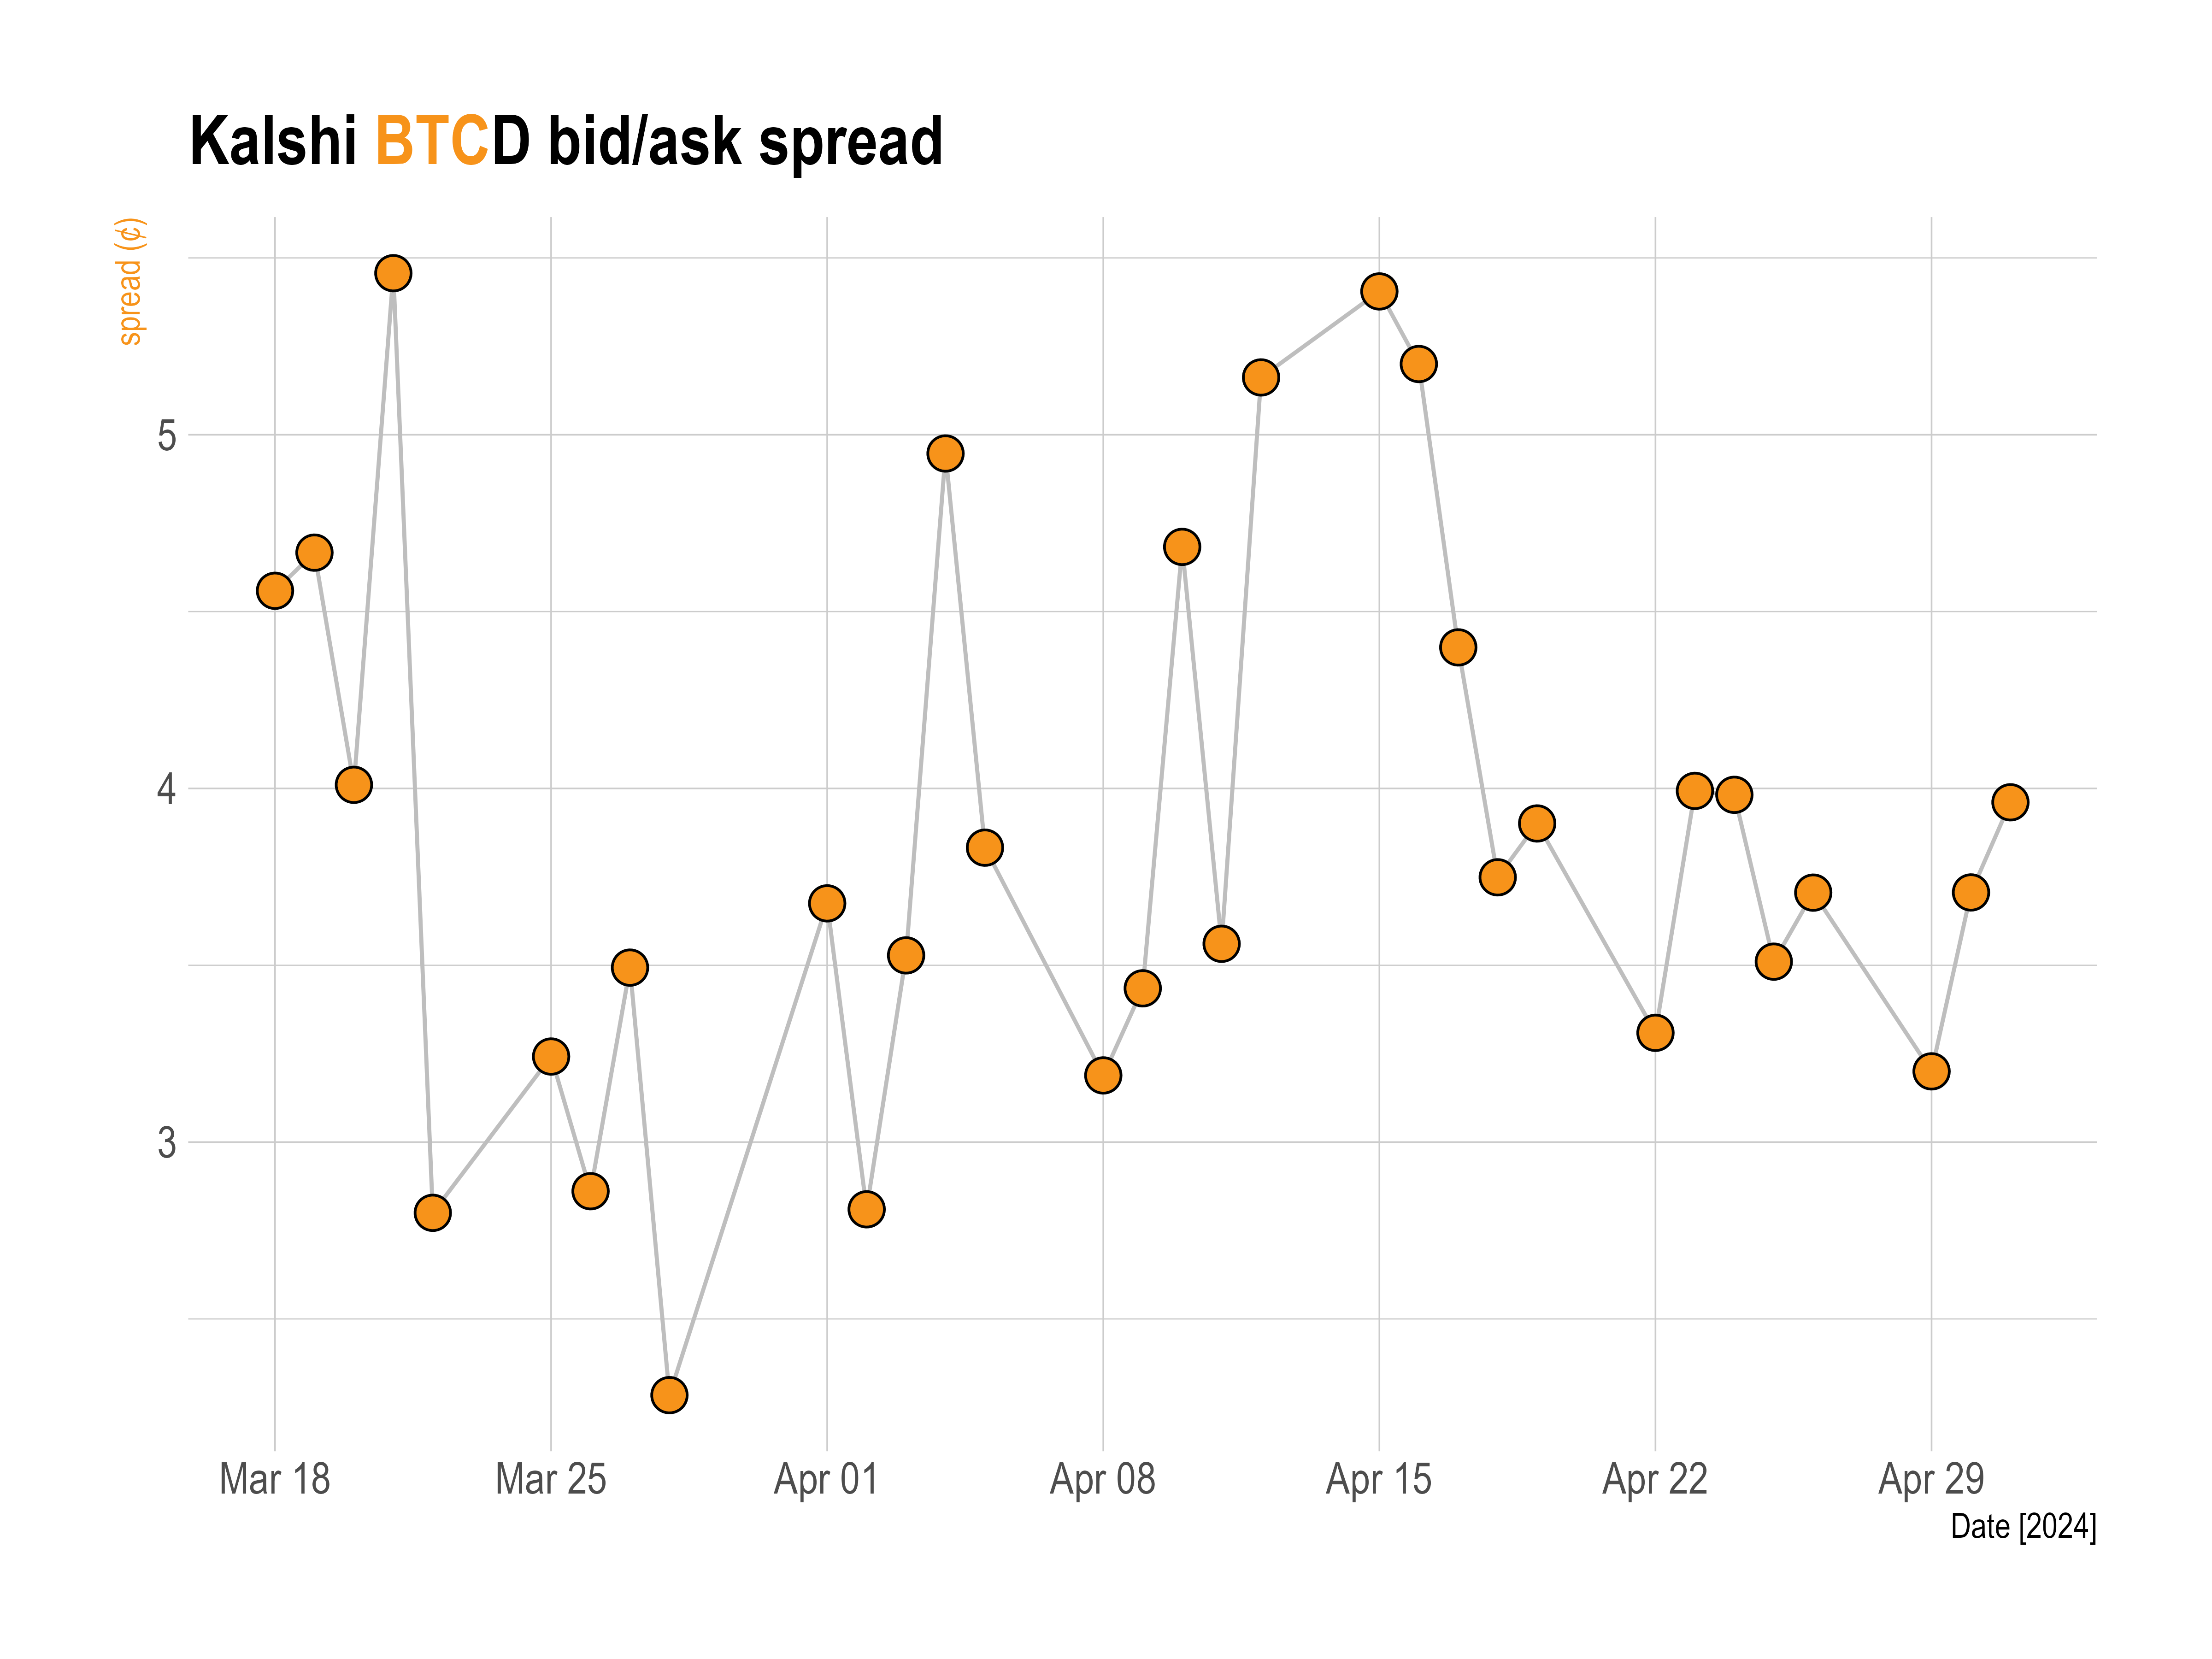
That being said, the spread is still important, as I've shown here.
So what is Kalshi? And what are event contracts? If you aren't familiar, I'd recomend checking them out and understanding them before continuing. Let's start by retrieving our data. Kalshi provides an API where you can place orders and access market history. The market structure of the exchange is simple, but it's a bit different than equities or derivatives. It's organized as Series -> Event -> Market with a series being the highest level, and a market being the lowest. For example, the INX series ticker represents "S&P daily close price range". This series has an event each day, for example, "S&P close price range on May 6, 2024". This event has the individual markets that are traded on, for example, "S&P close price range on May 6, 2024 is between $5,100-$5,124.99". Every market has its own orderbook and trades, so iterating through every market and event is critical for analyzing any particular series.
When getting spread data, I wanted to take a realistic bid-ask spread. What I mean by this, is when a market becomes "dead", a spread might be wide and skew our data since the outcome is sure to be determined YES or NO with certainty. For example, in the "Highest Temperature in NYC on May 5, 2024" event, there is a market that prices the weather at "54° or below". Once the temperature reaches 55°, everyone should know that the market will inevitably resolve to NO. So the NO-ask will be priced at 100¢, and in some cases 99¢ (I assume due to a combination of volume rebates and mispriced algorithms). If there are no outstanding NO-ask orders, Kalshi's market history returns the best ask price as 100¢. There will simultaneously be many NO-bid orders priced at anywhere between 1¢ and 99¢. So if we include this in our spread data, we would record a spread of likely more than 50¢, when the cause isn't due to lack of liquidity or pricing trouble, but rather the market being prematurely deterministic.
To solve this issue, I will assume that individual trades are made rationally, when bid-ask spreads can be trusted and the market isn't dead. By finding the Best Bid and Offer at each individual trade, I should get competitive spreads. Doing this looks like:
data = []
i=1
while i < len(markets_response['history']):
    if markets_response['history'][i]['volume'] > markets_response['history'][i-1]['volume']:
        data.append(markets_response['history'][i-1])
    i+=1
return data
*Note: It should be mentioned that yes_price = 100 - no_price and equally no_price = 100 - yes_price
Following, we notice that any outstanding NO-ask is equivalent to YES-bid at price of 100¢ - NO-ask price. Indeed, when you submit a limit order, Kalshi displays and adds this in both YES and NO terms to the orderbook.
I iterate through every timestamp in the market history and compare the current volume to the last. When volume changes, I know someone has filled an order, and record the best YES-ask and YES-bid. Doing so gives me a list of all unique instantaneous bid and ask spreads that were crossed in each market. Another comment to make is that Kalshi's built-in get_trades API function won't work for finding trade spreads. This is because they only return the trade price. When converting timestamps and searching for this trade in history, you quickly find there is often a big interval between the recorded trade timestamp and its recognition in the market history volume. Creating an interval timestamp searching algorithm disappointingly leads to an even more inefficient way to collect this data by orders of magnitude.
I've decided, partially arbitrarily, to look at the series: INX INXU NASDAQ100 NASDAQ100U BTCD.
These should give more narrow spreads given their volume and popularity (also, SIG moved into many of these in April). Calling and downloading all of this data took nearly 2 hours. It collectively represents over 1.5 million individual bids and asks. To look at these spreads, I opened and plotted them in R/RStudio. They reveal the following statistics:
INX

INXU

NASDAQ100

NASDAQ100U

BTCD

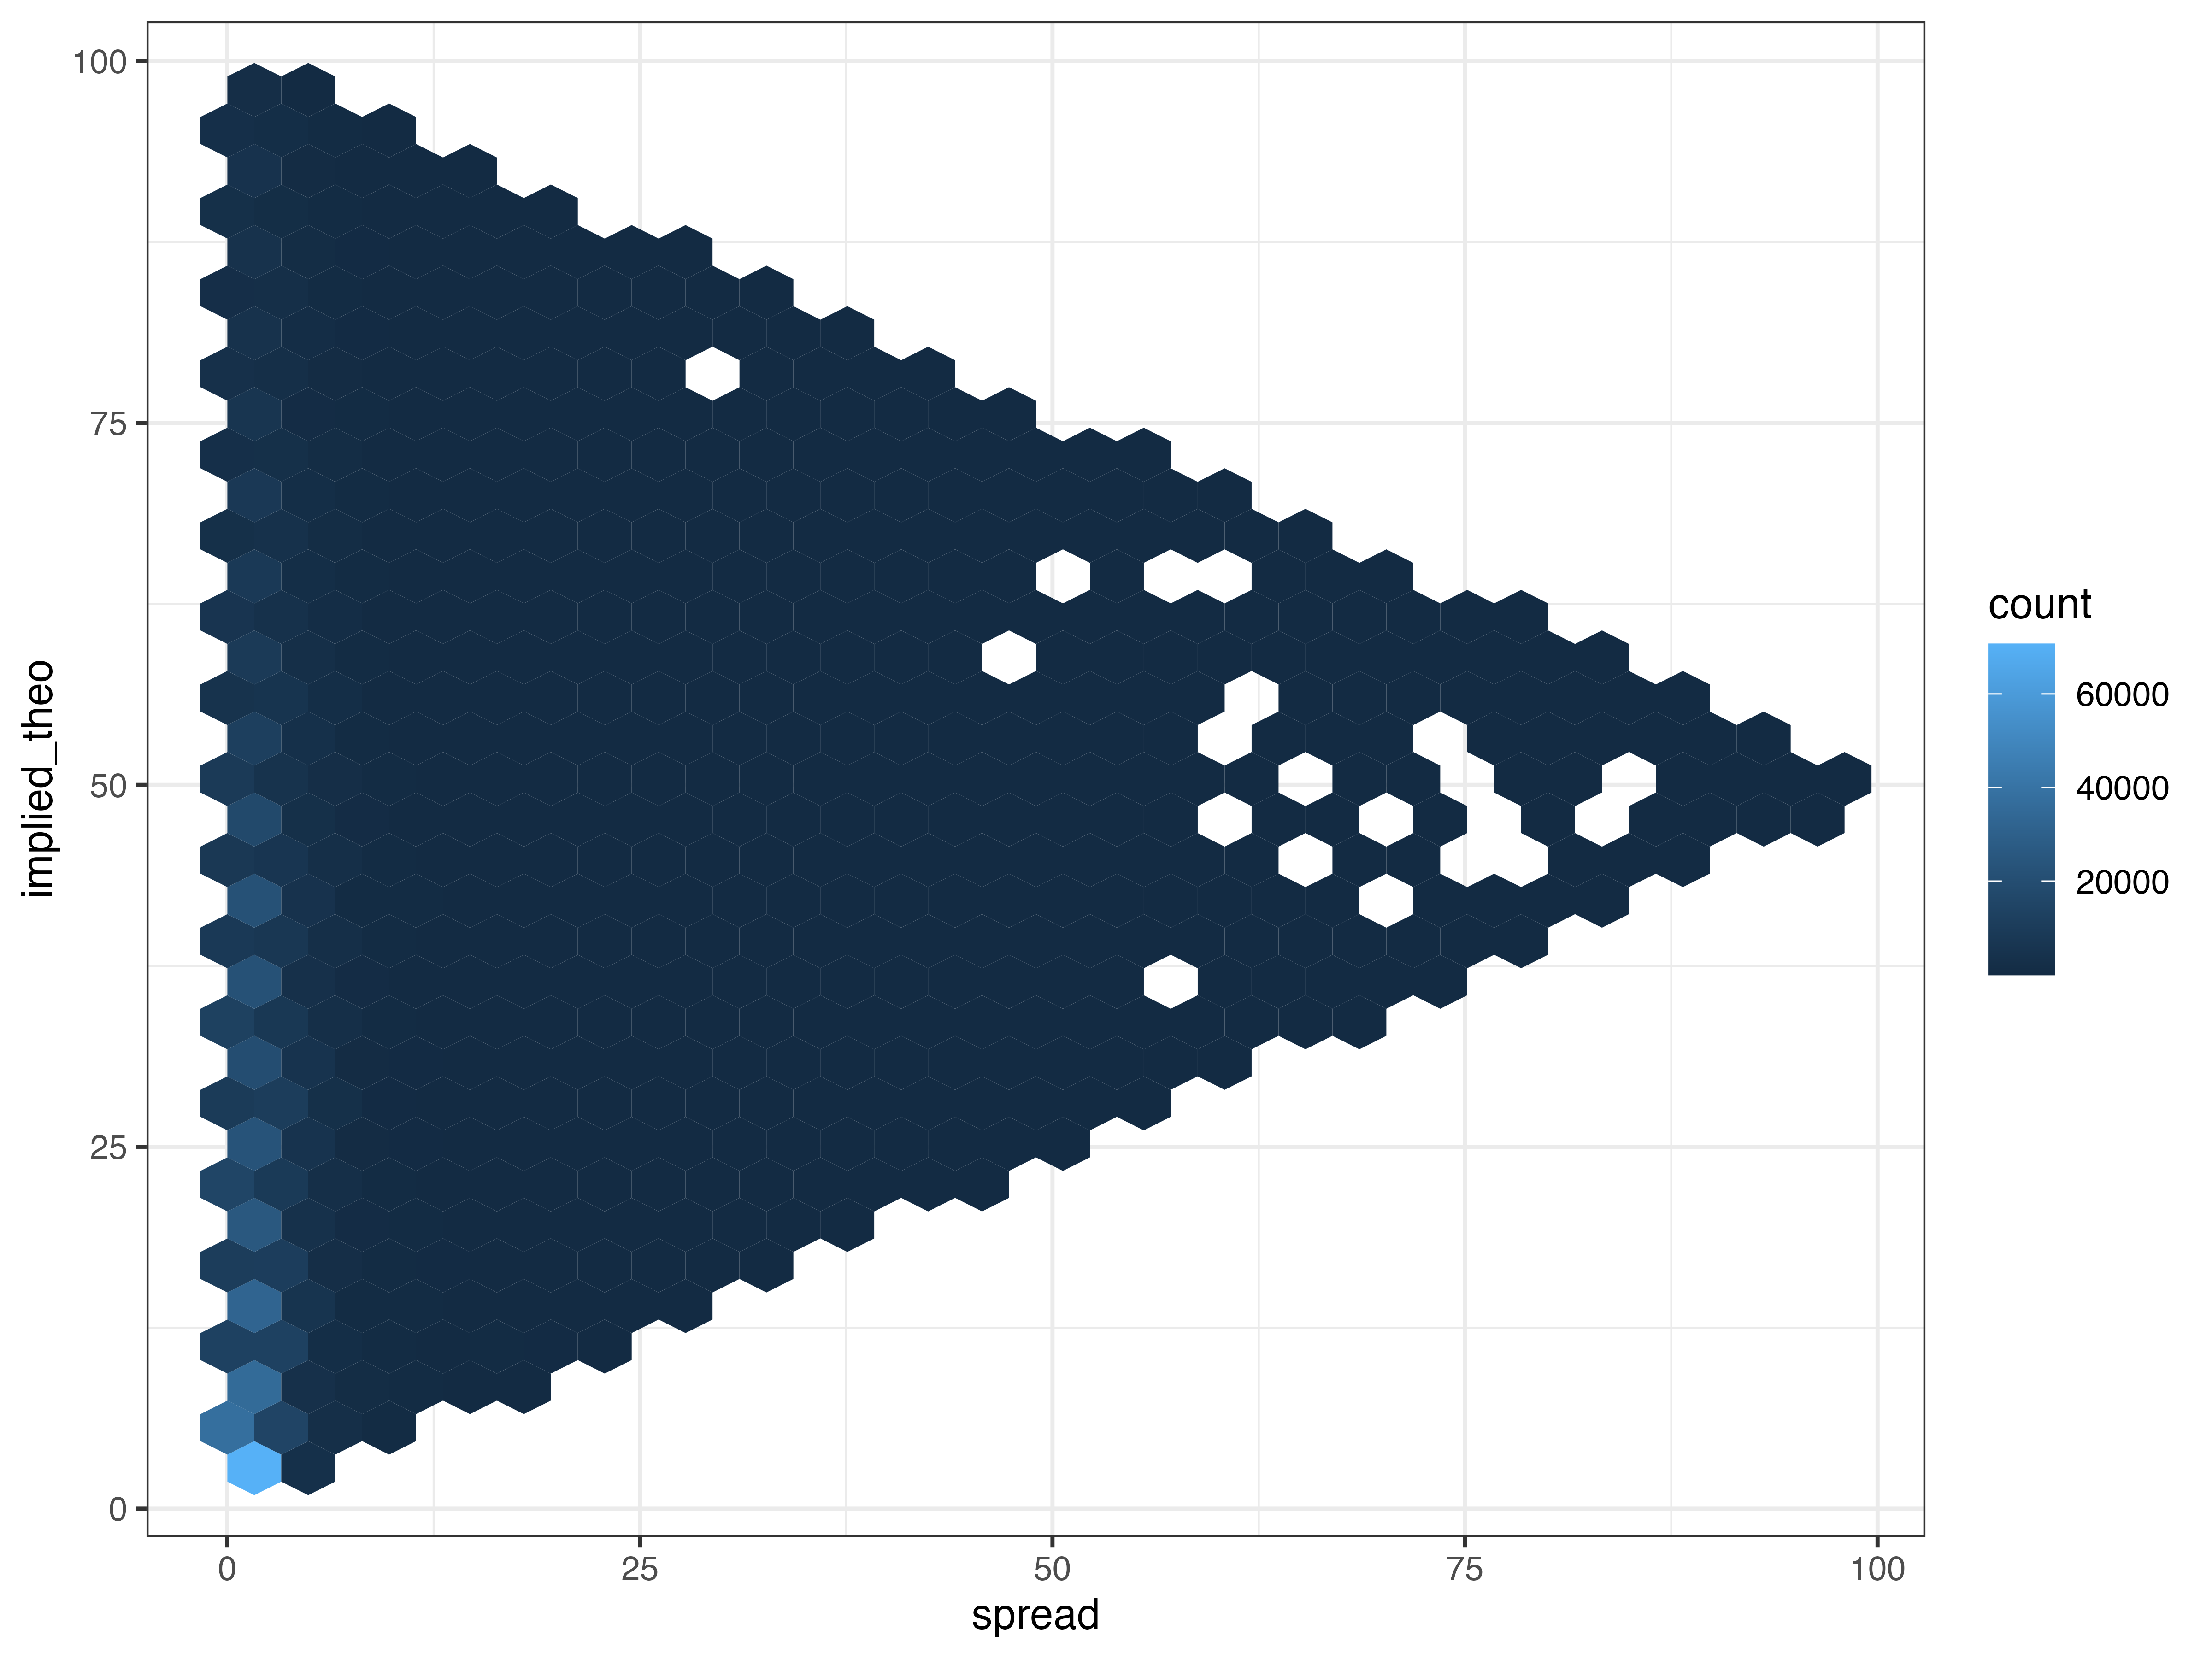
Any reference to an implied_theo column represents the mean between the YES-ask and YES-bid, providing the implied theoretical value of each contract.
First thing to note when looking at these results is that the series INX and NASDAQ100 have low average contract values: around 25¢. However, this makes sense. These markets give ranges, so they will naturally be skewed right. Our hypothesis is strengthened when looking at the above/below series INXU, NASDAQ100U, and BTCD, which have an implied_theo of close to 50¢.
When now visualizing this data, I will use the common three-sigma rule (3σ) and filter out any outliers that this range characterizes. Some simple INX charts are:
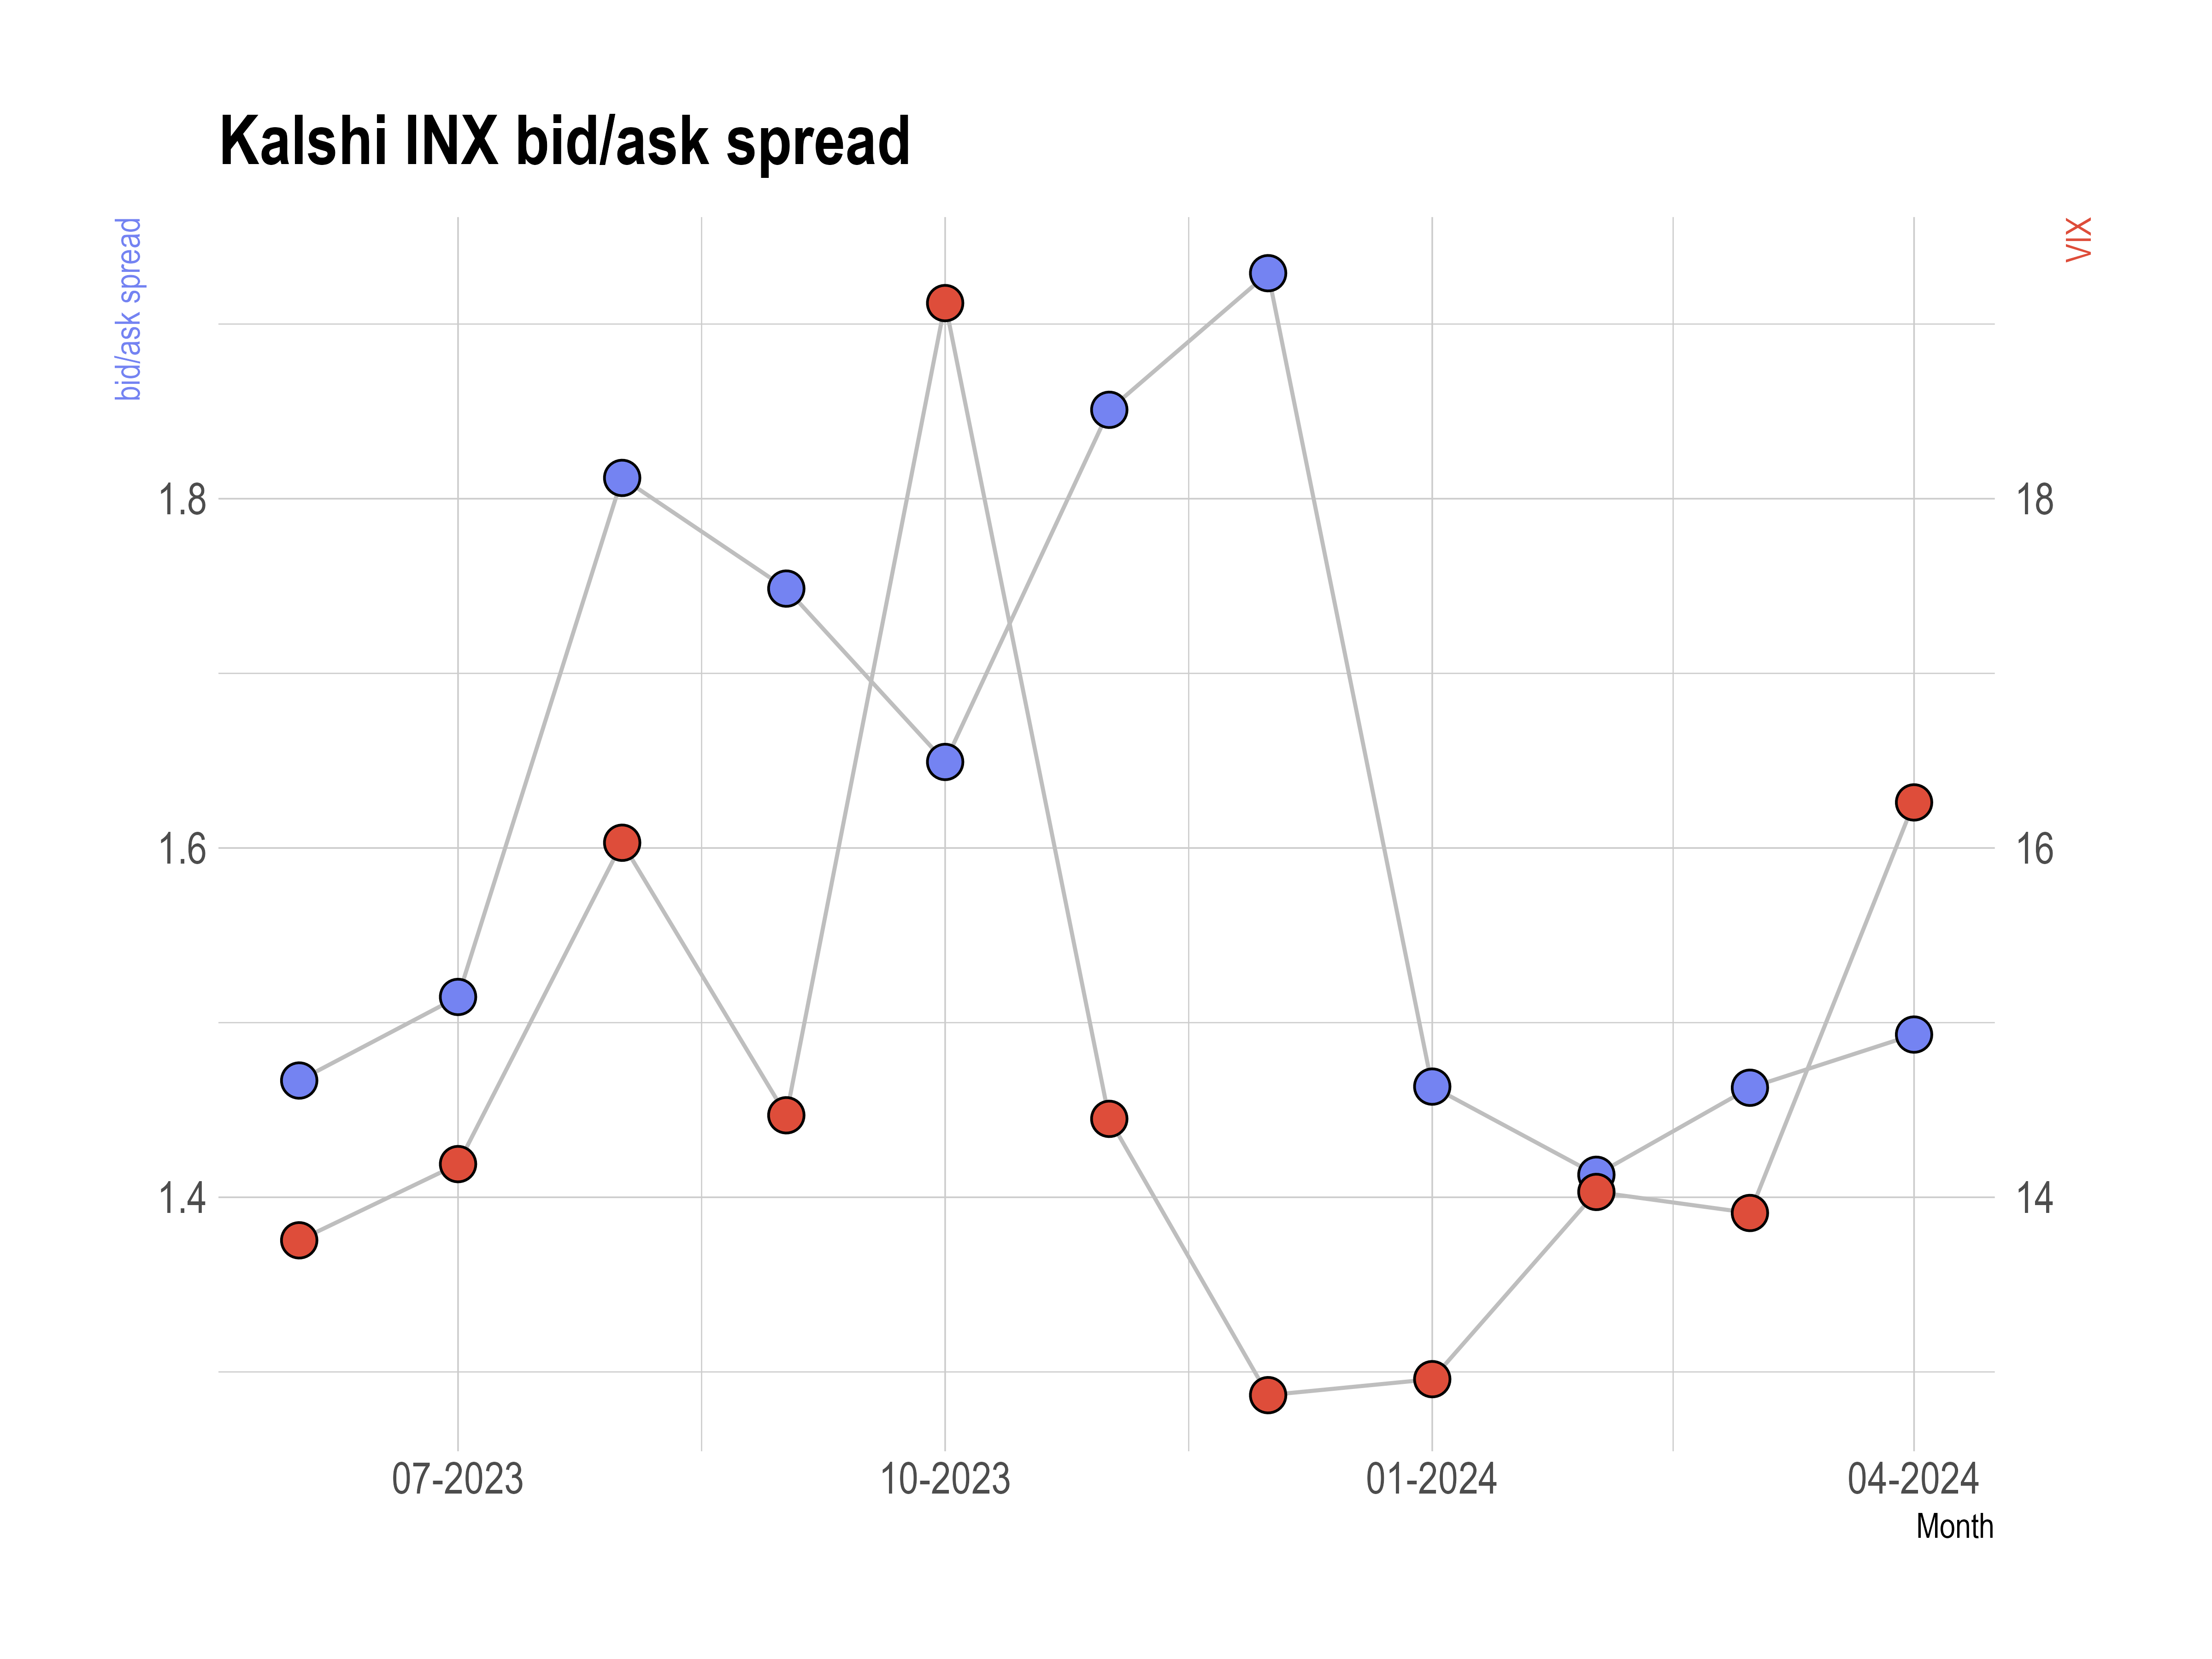
The first chart is straightforward - draw your own conclusions. My personal opinion is I don't see much spread improvement over the time period. But, a monthly spread average of under 2¢ is very narrow and to be expected in popular series like INX, especially considering volatility fluctuations.
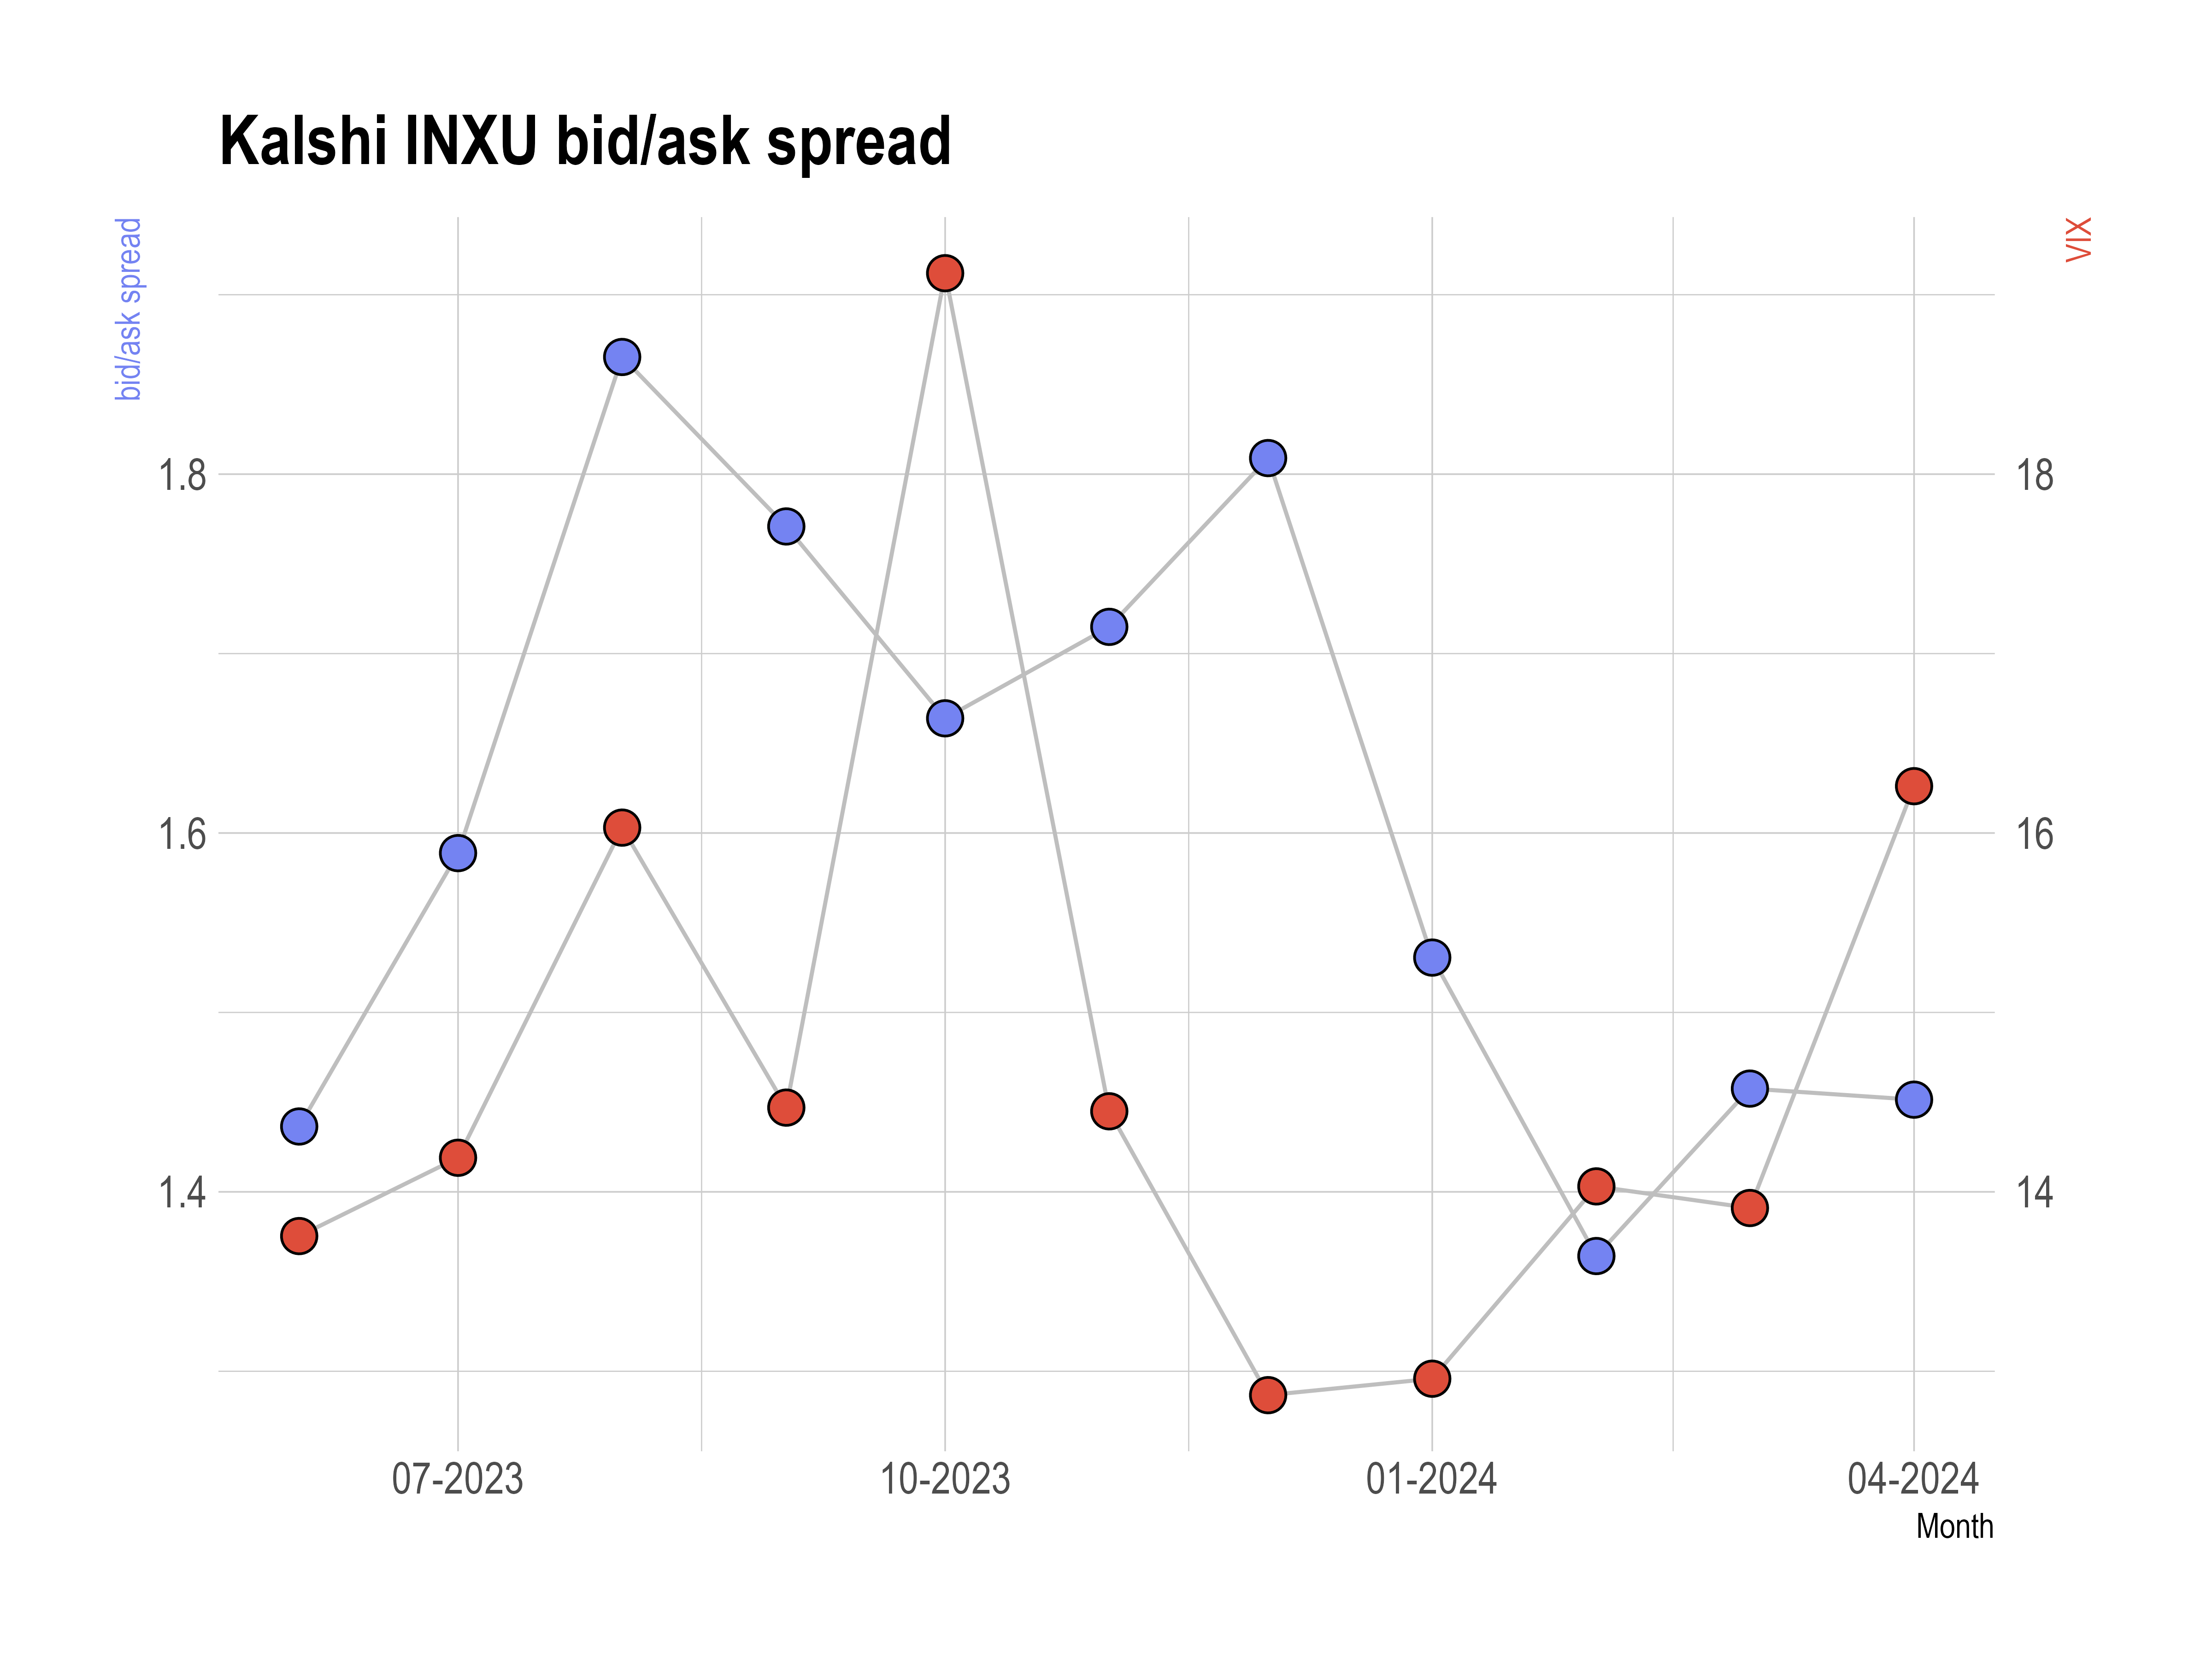
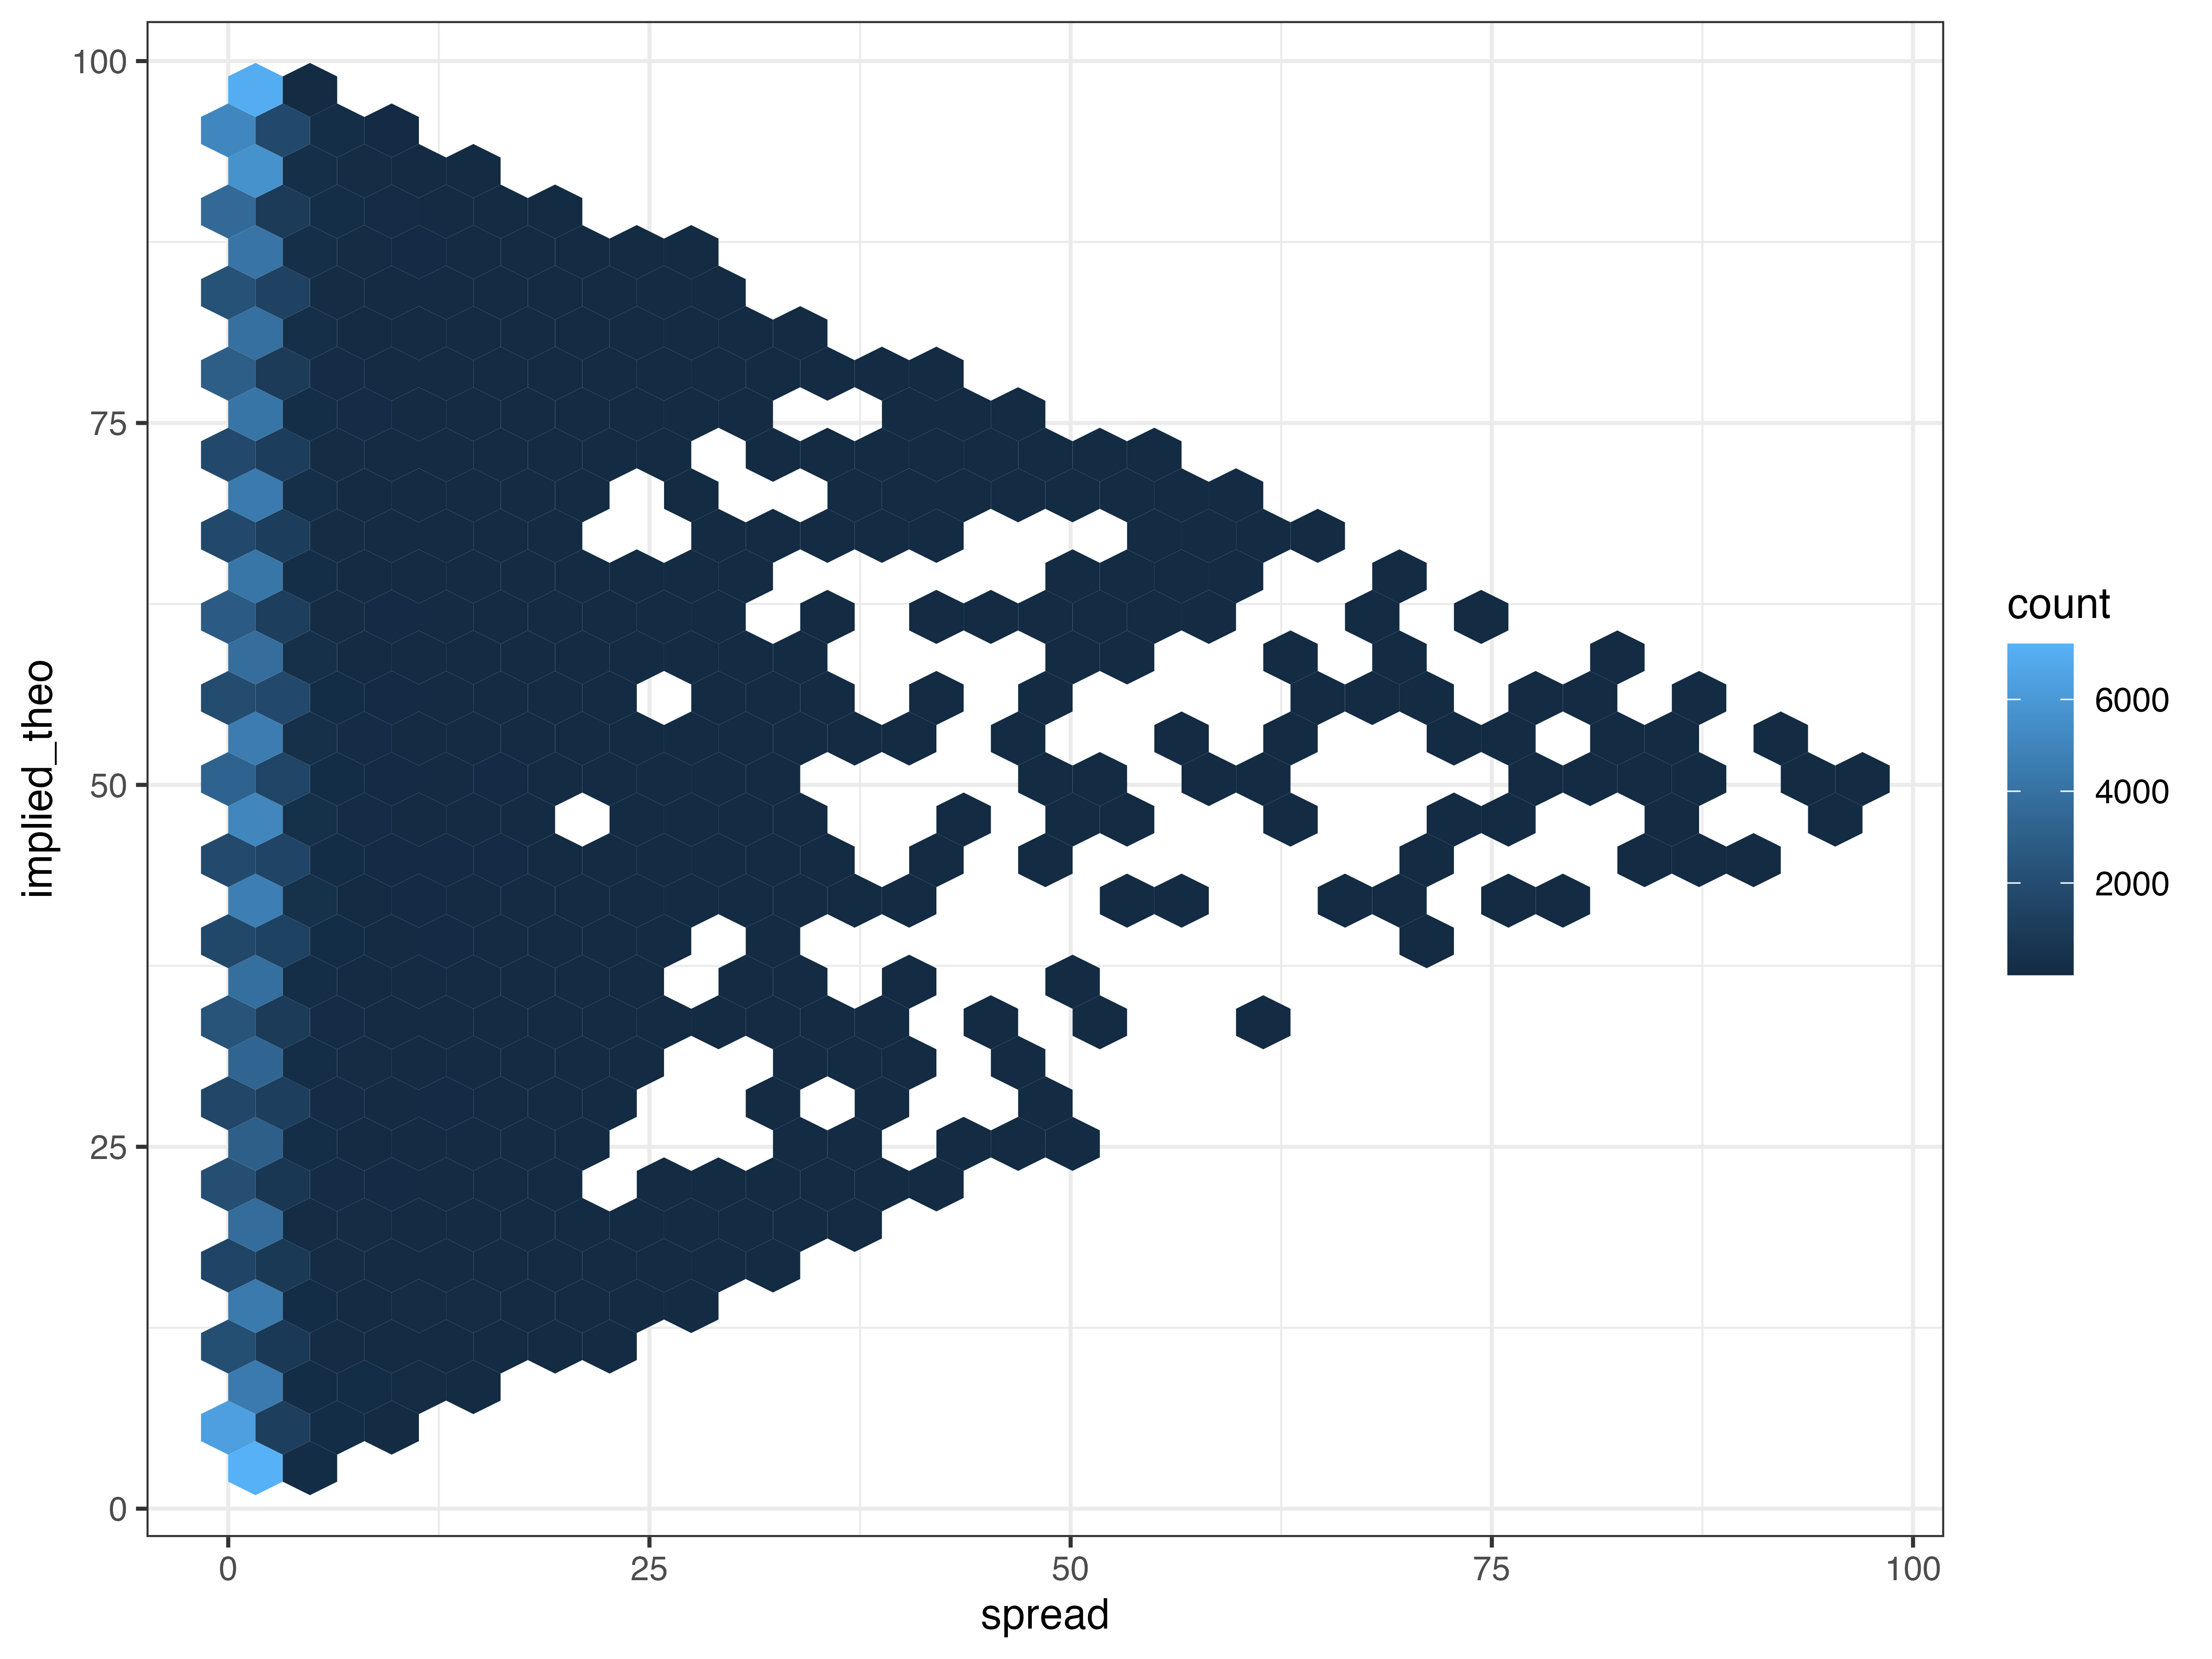
The second chart shows a density distribution of implied_theo versus spread. Naturally, slopes of gradient 1/2 converge to create a triangle. What is interesting is a high frequency of extremely low value contracts being traded. As seen below, the series INXU doesn't exhibit this trait, showing a bimodal distribution. This, too, falls from the nature of series pricing mechanism: range vs. above/below:
Here are the rest of the charts:


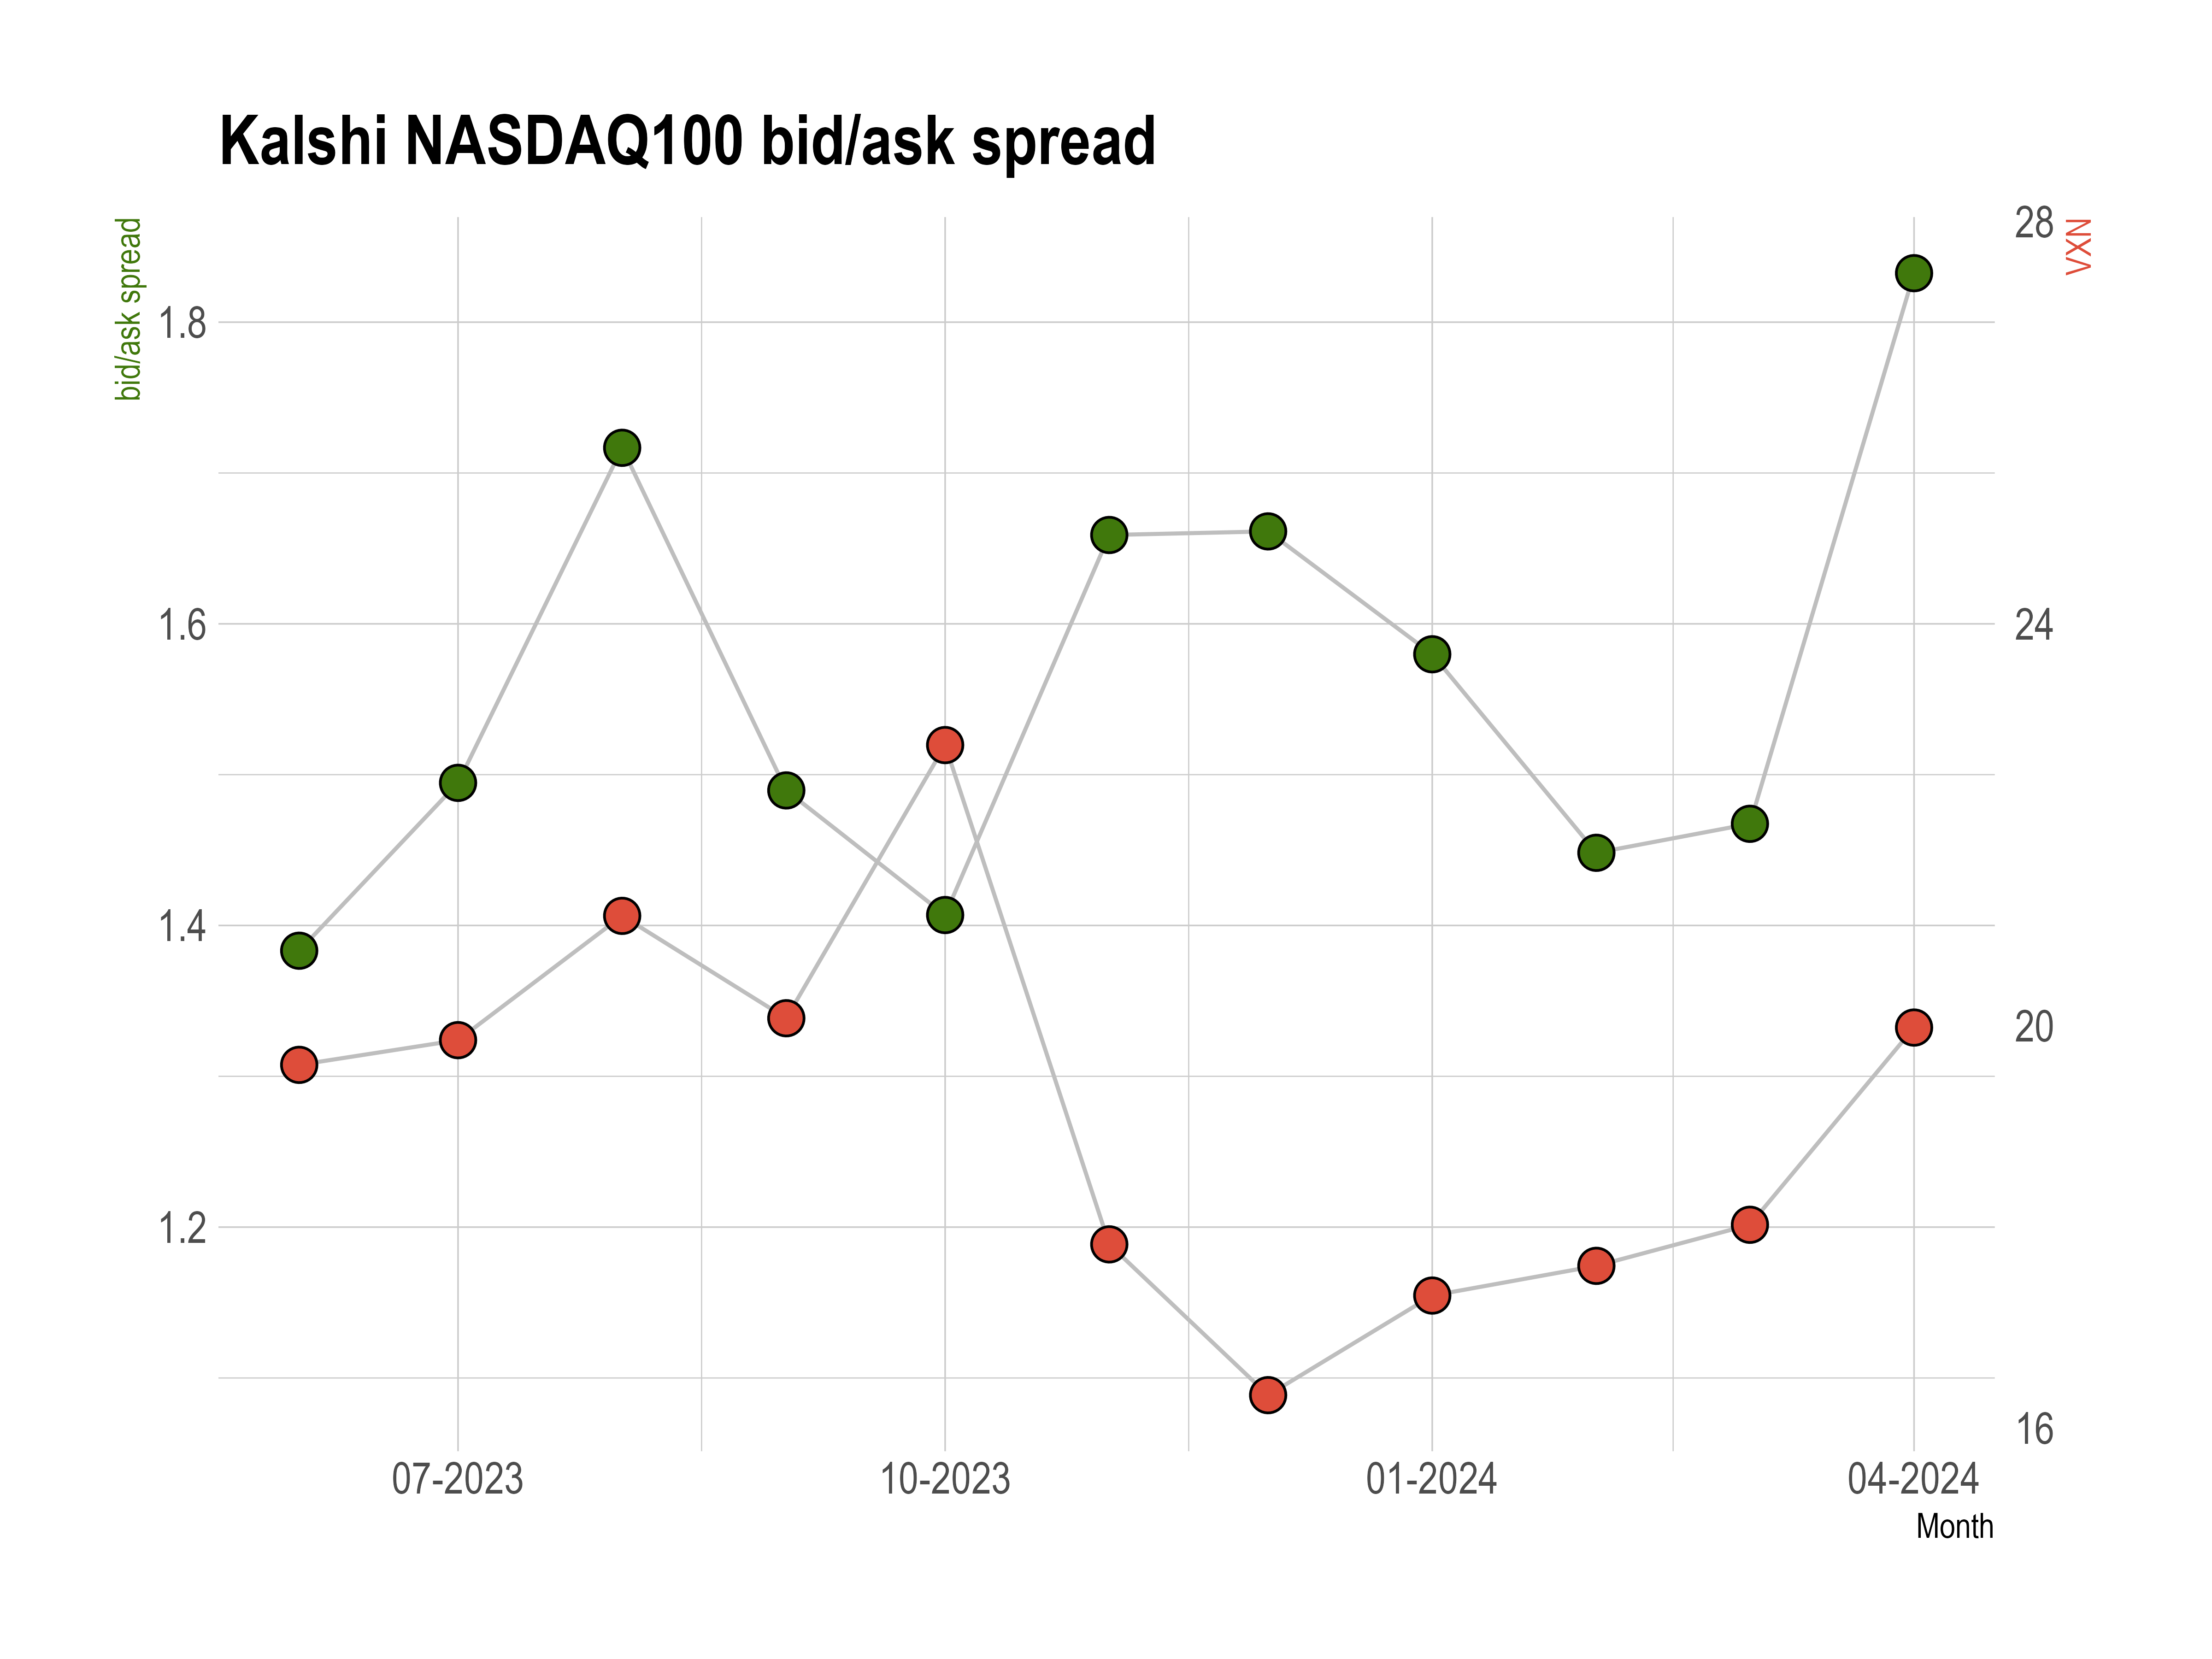
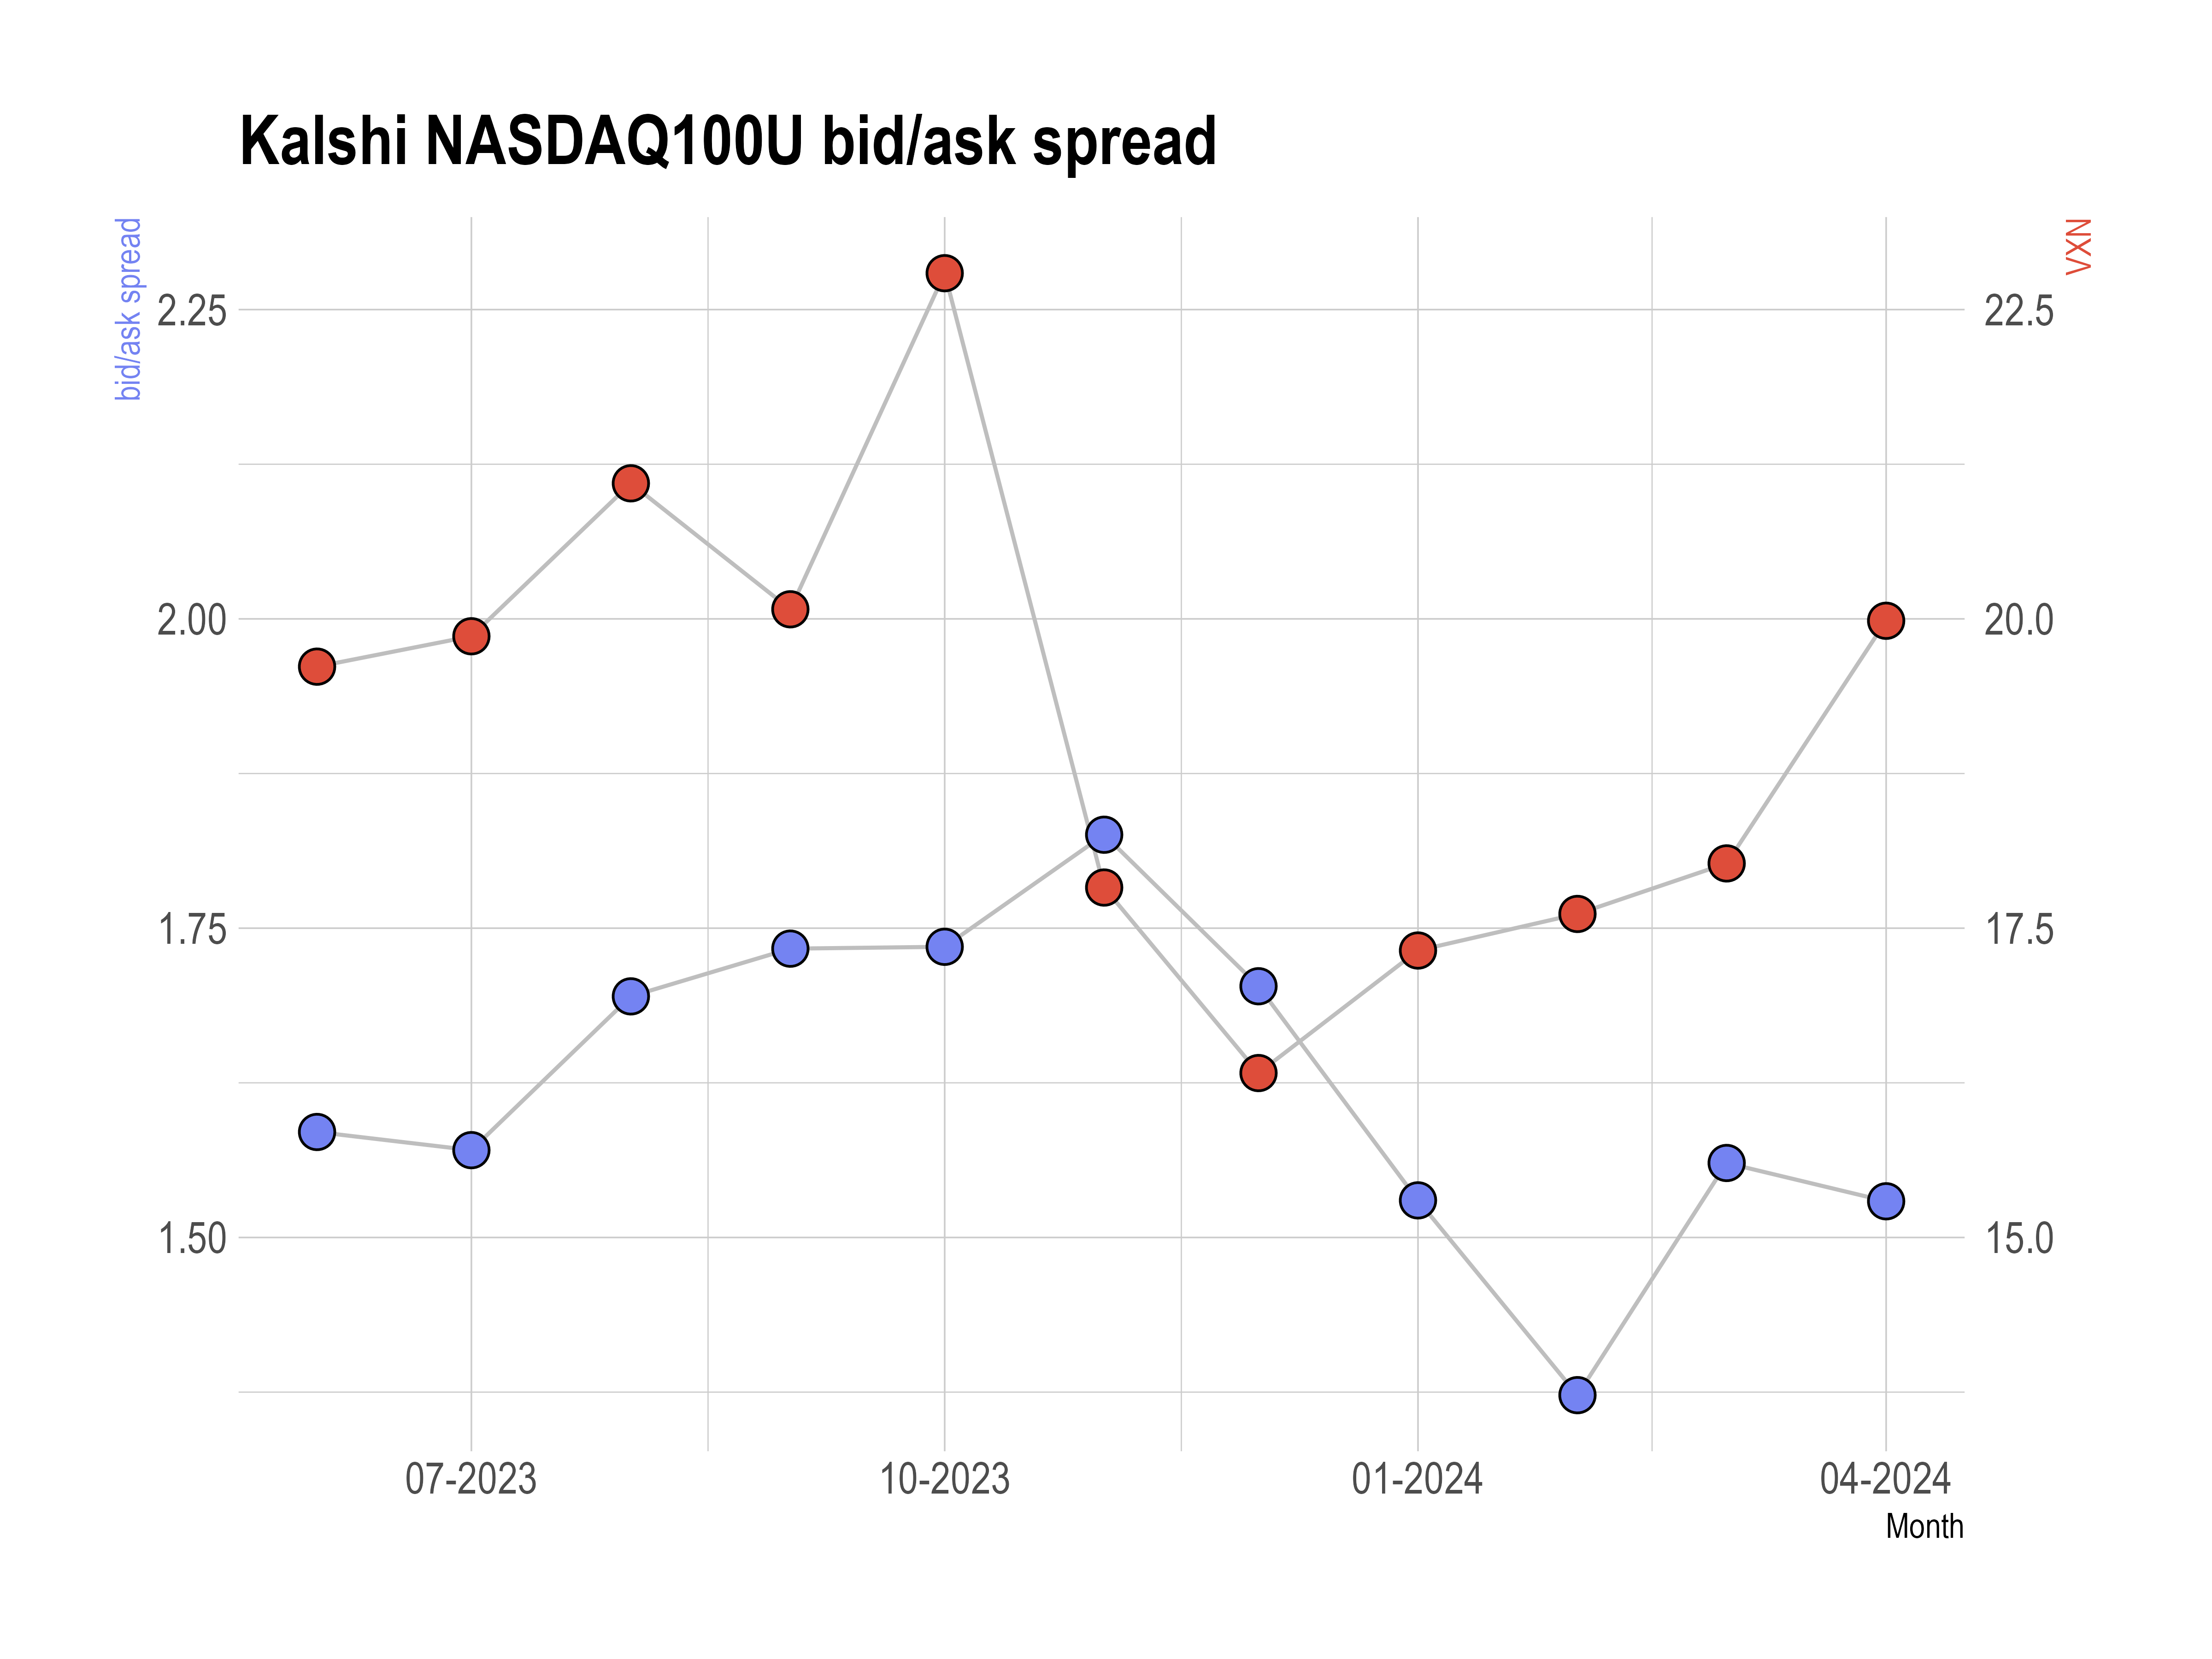
Thanks for reading! If Kalshi provided the full order book history, there would be a lot more to look at. I know this is quite surface level, but it should suffice for a first and hastily made post. More is coming - particularly surrounding a more scientific BTC volatility project and more when I get to it...
All graphs, text, and materials on this page are original. Please do not reproduce this media without permission.