To preface, this project's aim is to price the Bitcoin Daily above/below ranges on Kalshi [Ticker: BTCD]. I won't go through full details on my methods, as my results are very close to the prices of Kalshi Trading (KT), meaning if KT leaves the market, I would profit.
From the volume and liquidity, it is clear either Kalshi Trading (Kalshi Market's spin off liquidity provider), SIG, or a very sophisticated individual is providing the bid/asks in this market. After SIG went down, I noticed the volume was still there, meaning our trades are almost always going to be against KT for now.
To price Bitcoin dailies, we first need data. I will simplify my pricing target by trading in 8 hour intervals, starting at 9:00am EST every morning, to expire at 5:00pm EST. You may gather the UNIX timestamps using:
def last_x_days(days = 90, time = time.time()):
    """Returns last x days of unix timestamps in 8 hour increments. List is reverse chronological, with newest dates at front"""
    seconds_in_8hr = 8*60*60
    timestamps = []
    start_timestamp = ((time-18000)//seconds_in_8hr)*seconds_in_8hr+18000 #gives closest 8hr interval timestamp, aligned with 5pm EST
    for i in range(0,3*days):
         timestamps.append(str(start_timestamp-seconds_in_8hr*i))
    return timestamps
I won't spoil the fun (AKA, these methods might make money, so you'll have to find it yourself), but there is a significant problem with doing what I have done above. Nonetheless, this is a great starting point!
Now you should use these timestamps to call your price data! This can be done through the Coinbase API:
def last_x_prices(days = 90, product_id = 'BTC-USD', granularity = 60):
    """Returns last x days of price data, at the timestamps"""
    timestamps = last_x_days(days)
    prices = []
    for i in timestamps:
        datetime_object_start = datetime.datetime.fromtimestamp(float(i)+4*60*60)
        datetime_object_end = datetime.datetime.fromtimestamp(float(i)+4*60*60+120)
        start = datetime_object_start.strftime('%Y-%m-%dT%H:%M:%S')
        end = datetime_object_end.strftime('%Y-%m-%dT%H:%M:%S')
        api_url = f" PLACE YOUR URL HERE "
        response = requests.get(api_url)
        if response.status_code == 200:
            data = response.json()
            prices.append(data[0][1])
        else:
            print(f"Failed to fetch Bitcoin price data. Status code: {response.status_code}")
            prices.append('None')
    return prices
You'll also need the live price data:
def current_price(product_id = 'BTC-USD', limit = 1, payload = ''):
    # Create an SSL context that ignores certificate verification errors
    context = ssl.create_default_context()
    context.check_hostname = False
    context.verify_mode = ssl.CERT_NONE

    conn = http.client.HTTPSConnection("api.coinbase.com", context=context)
    headers = {'Content-Type': 'application/json'}
    conn.request("GET", f" PLACE YOUR REQUEST HERE ", payload, headers)
    data = json.loads(conn.getresponse().read().decode("utf-8"))
    return (float(data['best_ask'])+float(data['best_bid']))/2
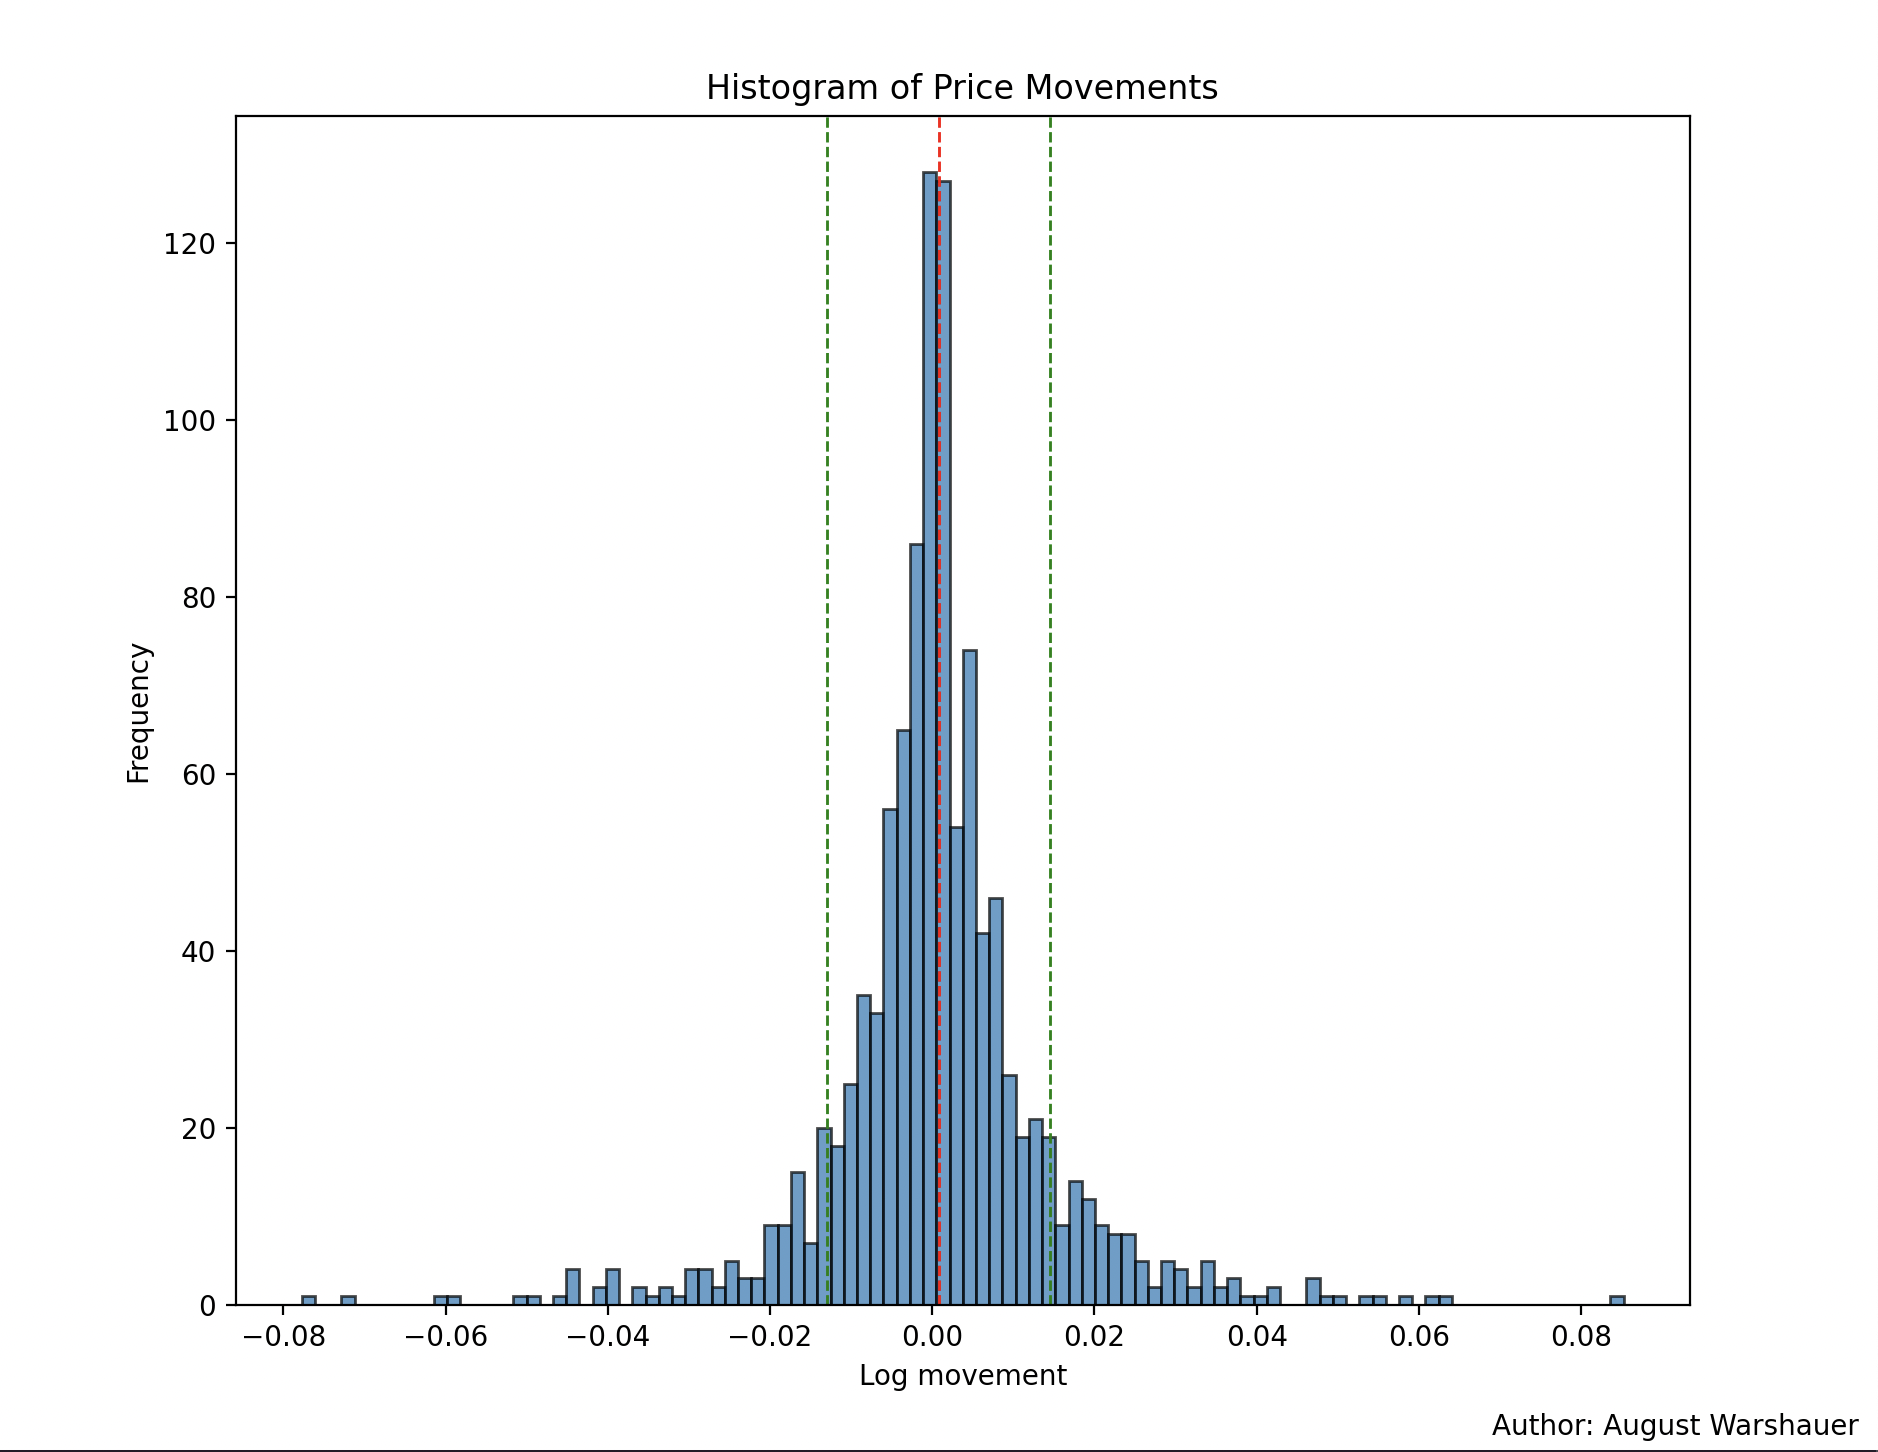
Now that you have the data, start making your prices! I recommend you read up on implied and realized volatility, and specifics on how to calculate them. There is a really nicely written piece by Noelle Acheson from CoinDesk. Since you have already found all historical data, backtesting doesn't need to be done through Kalshi, but can be done simply via historical prices. All of my methods are empirical, and this is likely the best way to go given the pricing distribution isn't normal:

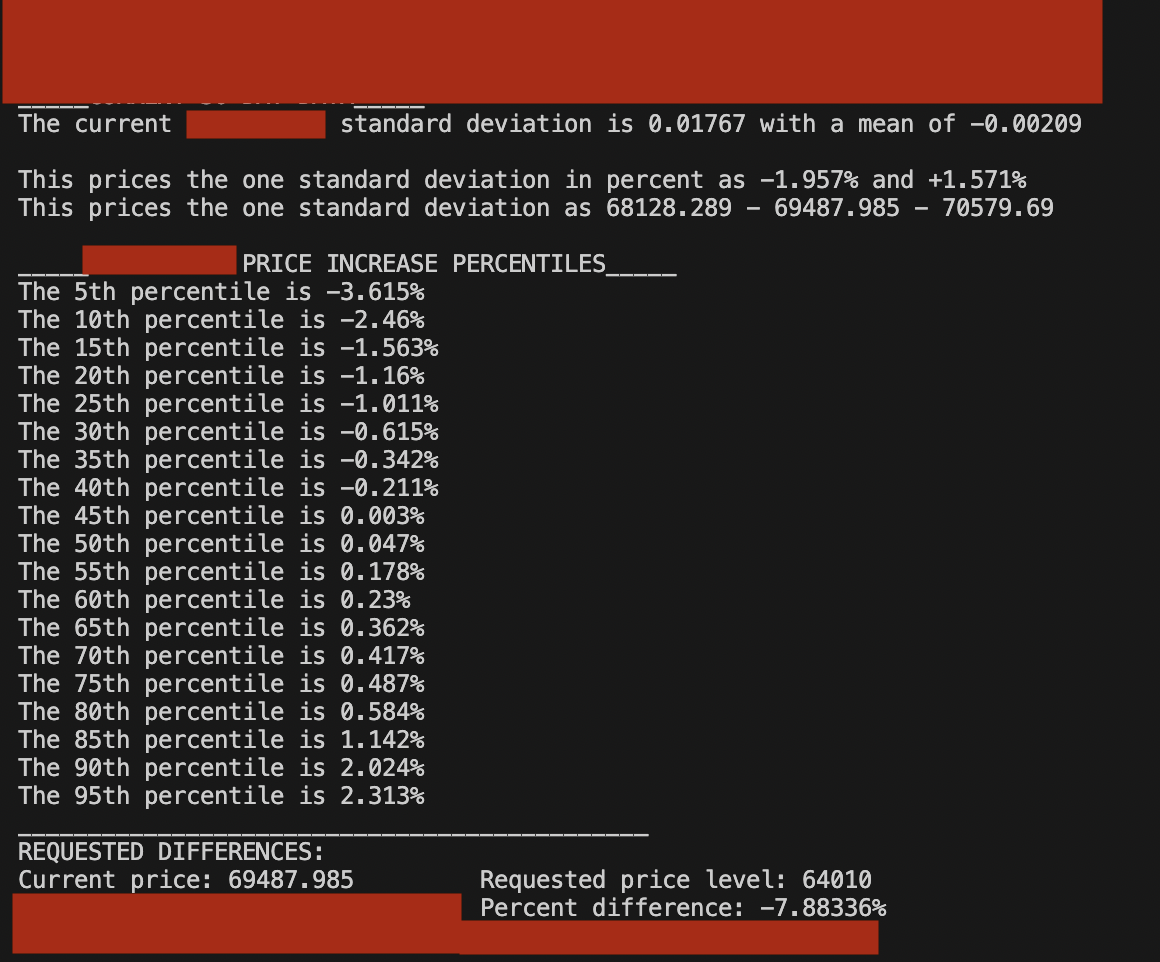
My price function returns instantaneous results that use realized & implied volatility to look like:

This will price contracts within 2-4¢ of the KT prices. With variance and the possibility that they are priced better than me (this is literally their job), I don't view this edge as wide enough. Thanks for reading!
All graphs, text, and materials on this page are original. Please do not reproduce this media without permission.